Process / Deployment Flowchart
Flowcharts power lies in their ability to provide a comprehensive overview of a process. Deployment as the name suggests, encompasses the whole organization from start to finish, highlighting the main steps and decision points.
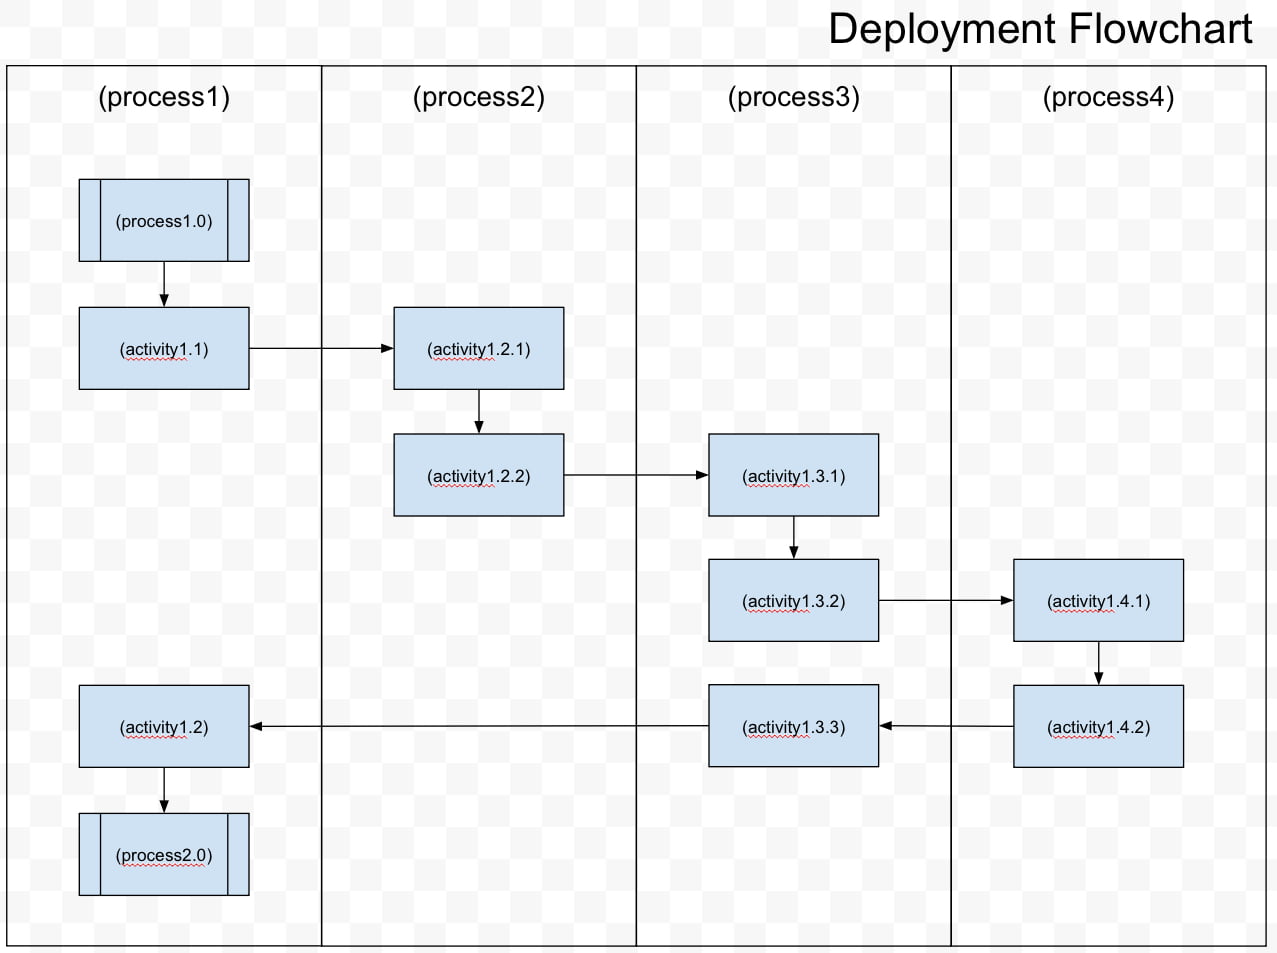
Chapter 1: What is it?

The main purpose of process flowcharts is to provide a clear and concise representation of a process. By visually mapping out the steps and sequence of a process, flowcharts enable individuals to easily understand and follow the process. They serve as a crucial tool for clear documentation, allowing for effective communication and collaboration among team members. Process flowcharts also provide a holistic view of the process, helping identify bottlenecks, inefficiencies, and potential areas for improvement.
Chapter 2 : When do I use it?
Macro level process flowcharts and micro level deployment flowcharts are powerful tools that can help organizations optimize their operations. Macro process flowcharts provide a high-level overview of the entire process, showing the different stages, inputs, and outputs involved. The micro deployment flowcharts allow organizations to identify any inefficiencies or bottlenecks between individuals and groups that may exist and make necessary adjustments to streamline the process. By visualizing the big and small picture, decision-makers can make informed decisions to maximize efficiency and productivity.
Chapter 3: How do I use it?

Creating your own flowchart can seem daunting at first, but it is actually quite straightforward. Here is a step-by-step guide to help you navigate the process:
1. Identify the process: Begin by understanding the process or system you want to represent. Break it down into smaller steps and decision points that define its flow.
2. Determine the symbols: Decide which symbols you will use to represent processes, decisions, and the flow of the process. Make sure to use standardized symbols for clarity.
3. Arrange the symbols: Place the symbols on your page or computer screen in the order they occur in the process. Use arrows to connect them and indicate the flow of operations.
4. Test and refine: Once you have created your initial flowchart, test it by following the process step-by-step. Make adjustments as needed to improve clarity and accuracy.
By following these steps, you will be able to create flowcharts that effectively represent any process or system.
Chapter 4 :Why should I use it?
Flowcharts are an invaluable tool for enhancing efficiency, and their power lies in their ability to provide a comprehensive overview of a process. Macro flowcharts, as the name suggests, encompass the entire process from start to finish, highlighting the main steps and decision points. This bird’s-eye view allows managers and stakeholders to gain a holistic understanding of the process and identify areas that require improvement.
Chapter 5 : Coaching Benefits
![]()
I need help…
Not all help costs money. Requests for additional information and potential application for your industry, helps us to improve the training experience, at no charge to you.
When do I need coaching services?
Coaching has proven time and time again to be a powerful tool in optimizing performance and driving efficiency in various aspects of life. Whether it is in the workplace, educational settings, or even within personal relationships, coaching has the ability to unlock untapped potential and enhance productivity. By leveraging the collective intelligence and diverse skills of a group, individuals can capitalize on their strengths, overcome challenges, and achieve remarkable results.
What do I get with coaching services?
Our Role – Quality coordinating – Work to understand your system, review your needs, and suggest process improvements.
We help you use a chosen template and apply it to your business model, with or without action plans.
Coaching includes personalized shareable document for use or for future coaching.
1 hour online coaching (one on one coaching) no minimum participates

Download a Flowchart Template
Templates are like a secret weapon in the arsenal of content creators. They provide a foundation, a starting point that saves us time and energy.
Mobile Format
By using Google Docs we offer an extensive selection of free templates, covering various categories with no special apps to download making them truly mobile. These templates are also available in Microsoft Word format. These templates are designed by professionals, ensuring a polished and visually appealing outcome. With a few clicks, we can have a well-structured document, complete with headings, subheadings, and placeholders for our content. These templates act as a guiding hand, making it easier for us to organize our thoughts and ideas effectively. They eliminate the need to spend hours formatting and styling our documents, enabling us to focus on the content creation itself.
Simplify Creation Content
The true power of templates lies in their ability to simplify and streamline the content creation process. By using pre-designed layouts and formats, we can save valuable time and effort. Rather than starting from a blank canvas and grappling with design decisions, we can simply choose a template that aligns with our desired style and purpose. This not only speeds up the creation process but also ensures a consistent and professional look for our content.
Templates also allow for customization, enabling us to personalize the document according to our needs. This level of flexibility empowers us to create visually stunning content without the need for advanced design skills. Templates break down the barriers between creativity and execution, making content creation accessible to all.
Unleash Your Creativity
Effortless content creation is within our reach, thanks to the power of free templates in Google Docs and Microsoft Word. By utilizing these templates, we can simplify our workflows, save time, and produce high-quality content without the need for extensive design knowledge. Unlocking the potential of templates allows us to focus on what truly matters – our ideas, thoughts, and messages. So why start from scratch when we have a vast library of templates waiting to be explored? Embrace the convenience and unleash your creativity by utilizing the power of free templates in your next content creation endeavor.
What is a Process Flowchart
Watch this Video.
Flowcharts are an essential tool in the world of project management and process analysis. They provide a visual representation of how a process works, making complex procedures easier to understand. Whether you’re a student, a business professional, or just someone looking to improve their organizational skills, mastering flowcharts can be incredibly beneficial.
As You Watch this Video
1. First step to any flowchart is to standardize your symbology.
2. Start with you high level (macro) view of the process activities.
3. This macro view is used when management is planning the start and end of the process and the need activities between.
4. Swim lane flowcharts are used to “deploy” a specific activity to individuals or other support processes within the organization.
5. Deployment flowcharts is a visual representation as to who does what in an activity.
6. Flowchart can be the (SOP) standardized operating procedure or can reference a training document that further gives specific details of the process.
Still need to visualize, understand the design of the Process Flowchart or Deployment Flowchart and how the method is used, see the following video.
What is a Deployment Flowchart?
Watch this Video.
Deployment flowcharts are essential tools for visualizing and understanding the process of deploying software or systems. They provide a clear overview of the steps involved, helping organizations streamline their deployment processes and ensure efficient and error-free implementation.
As You Watch This Video
1. Start with a multidisciplinary team and determine the process, its start and end point and all the activities in between. (sequence of activities)
2. Now list the processes that contribute to the activities listed and deploy that activity as tasks on the flowchart to those processes, departments or individuals.
3. This does two things, displays the interaction between individuals and groups, and shows the flow of the tasks throughout the organization.
4. The tasks should be articulated in sequence and highlight the relationship between stakeholders.
5. Deployment flowcharts highlight any areas of inefficiency, duplication and or unnecessary processing.
6. When troubleshooting, examine the interfaces between participants, which are typically causes for delays.
Still need to visualize, understand the design of a Deployment Flowchart and how the method is tested, see the following case studies.
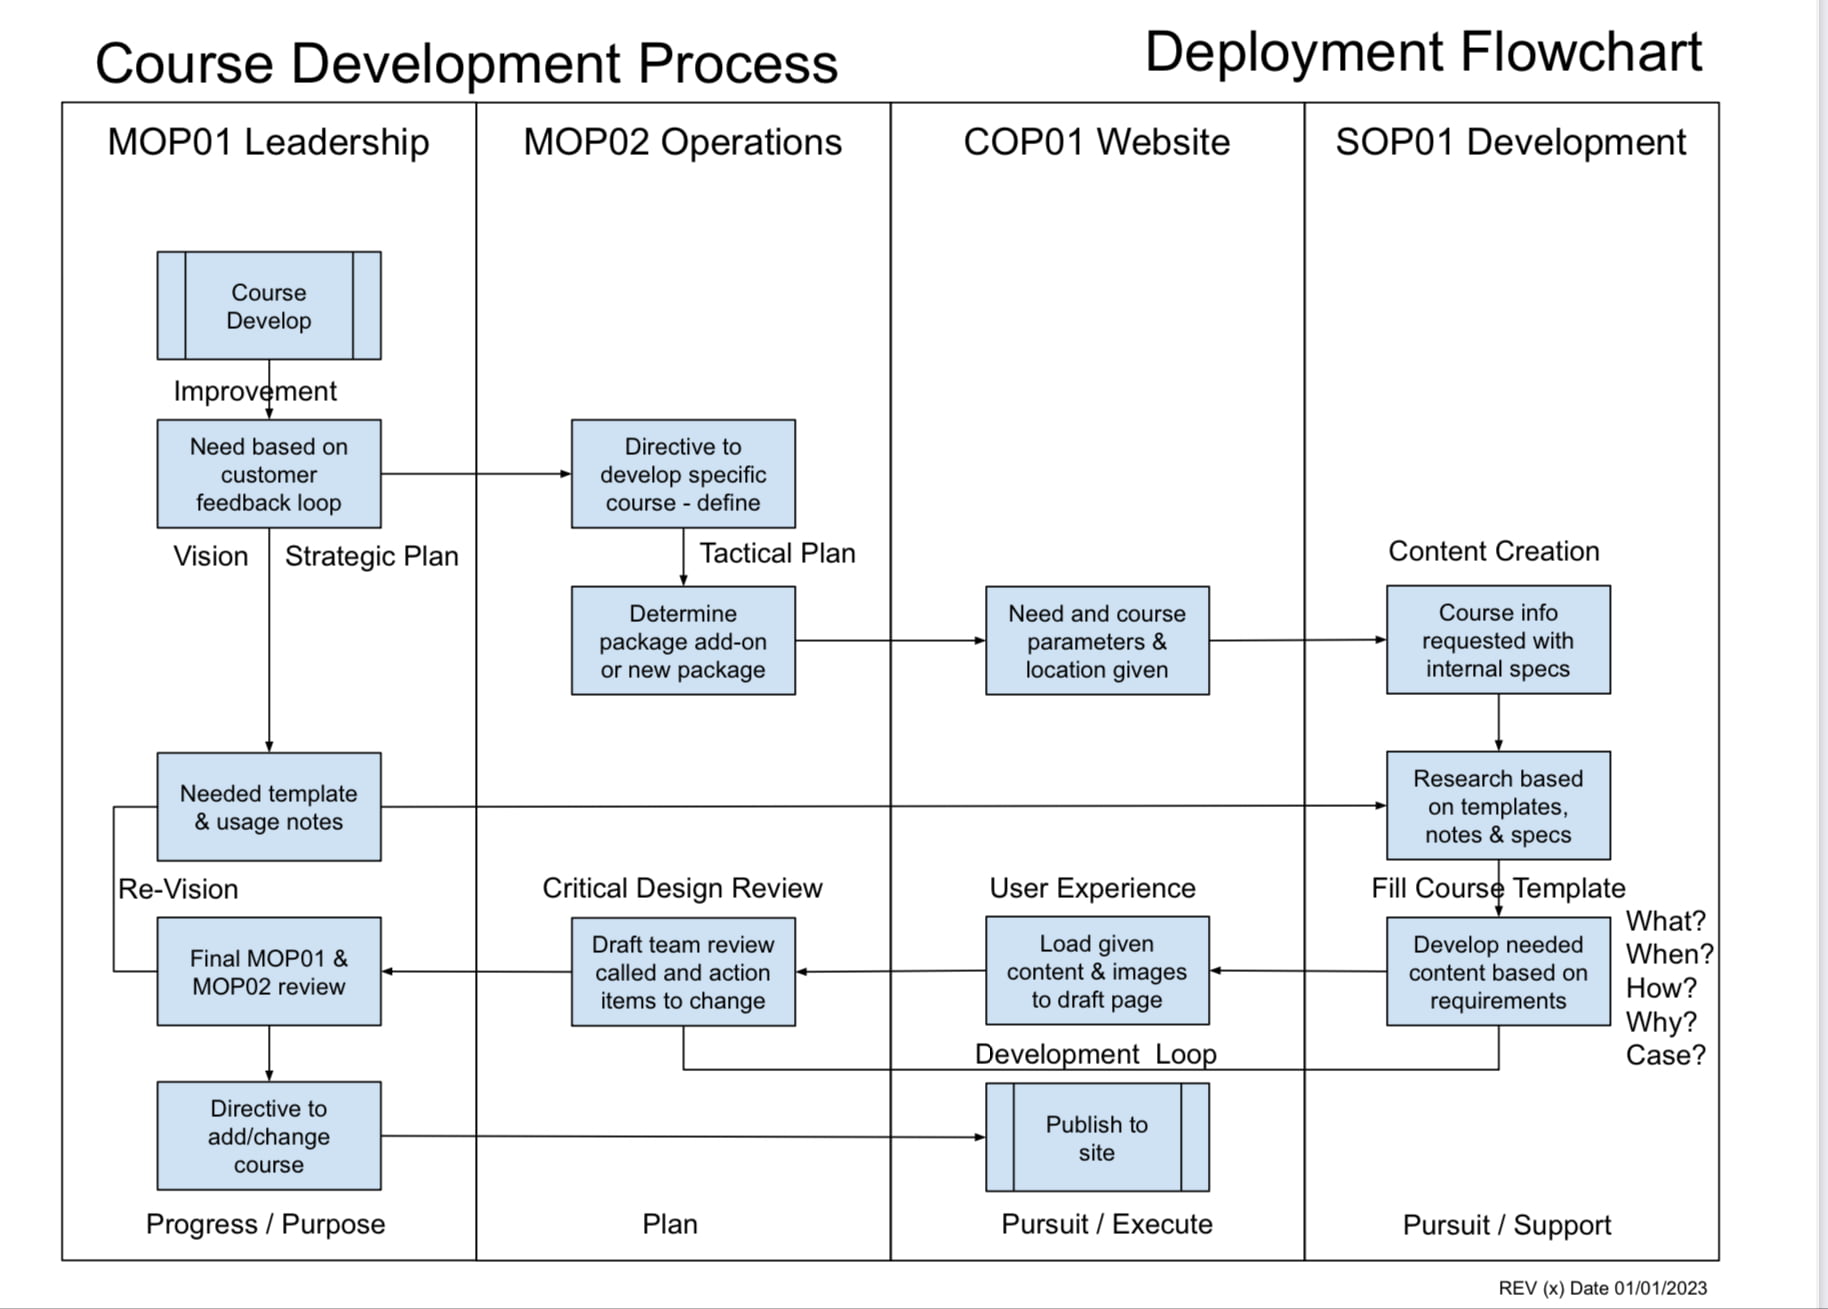
Case Study 1 - Led to Manage LLC
Our use of a Deployment Flowchart
Why we used this format
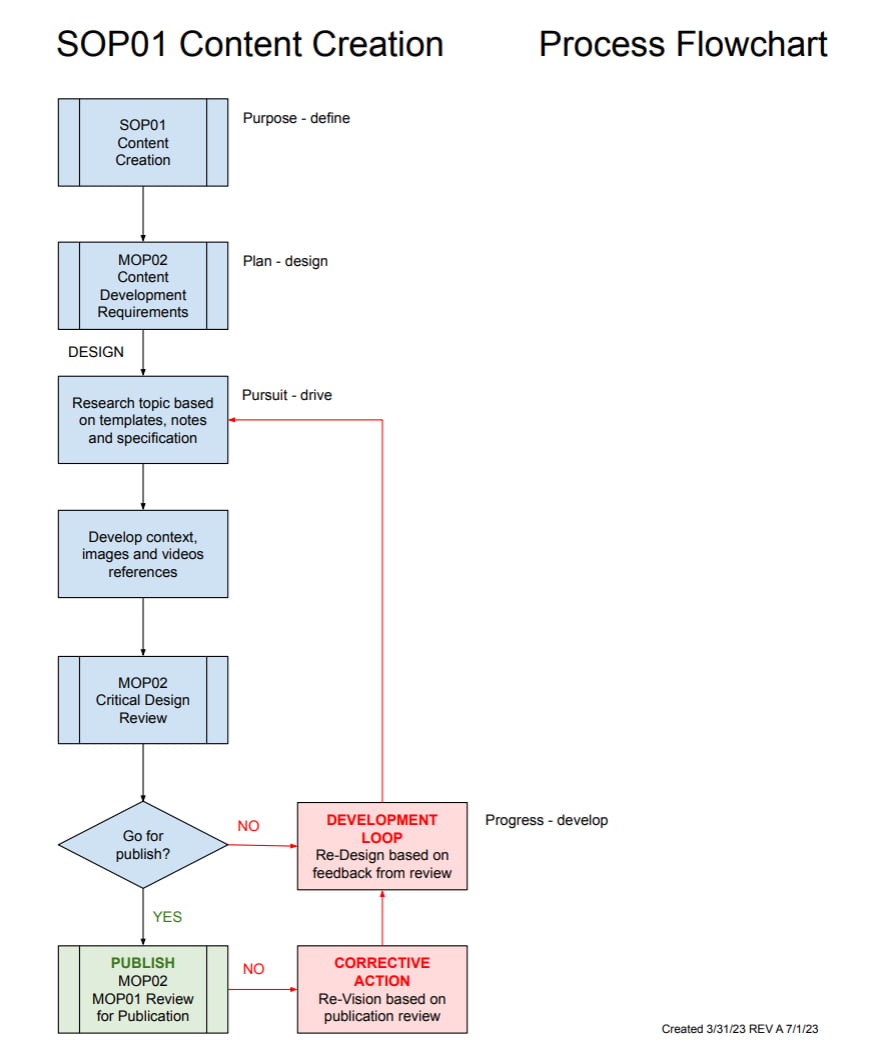
1. The team started with a standard flowchart, defining the start, end and the need activities to develop course content. Over simplification would be that the SOP01 Training Development Course Developer was responsible for this process.
2. It became obvious that multiple process owners need to initiate, support with plans, information or content, use of generated content, review then deploy the course content to the website.
3. By using both formats the supporting processes to SOP01 could be identified and tasks or their own predefined processes could be developed to support the course development process.
Lessons Learned
1. Front the first macro level flowchart to the resulting micro level deployment flowchart it was important the reference to other processes, terminology and descriptions remained consistent so that going from macro to micro flowcharts could be transitioned with ease.
2. Since we are a small organization and most processes have only one person staffed, the need for standardized operating procedures were not necessary, since website templates with starter explanations of need content were created, which served as a guide and giving key information needed for the development of a course.
3. The next concern was the timing of each activity so we did a value stream map (see Tactical Planning Design Course – Value Stream Map).
4. Once the timing was done on the Value Stream map the expectation of the course development portion of the Time to Delivery Model (see Purpose Defining Course – Time to Delivery) would be updated where applicable.